ESTIMATED COMPLETION TIME: 20 Minutes
CORE VERSION: 1.0.226
SUGGESTED PREREQUISITES: basic knowledge of Lua and Core Editor
TUTORIAL SUMMARY:
A hands-on tutorial on Core’s debugger.
(Sample scripts can be found in CC as a Debugger Tutorial Scripts template).
EXPECT TO LEARN:
- what a debugger is and how to use it for tracking down errors
- how to set breakpoints and navigate your script with Step Into, Step Over and Step Out buttons
- what a stack frame is and what information it provides
Squash'Em! (Introduction to Core's Debugger)
What is a debugger?
A debugger is a tool that helps you get a clearer idea about what’s going on in your script. By running a debugger, you monitor the execution of the program step by step, one line of code at a time – in the same exact order as it is being executed by the computer – which is especially handy when you are trying to track down an issue or a bug.
The most straightforward way to debug a program is to use the print function to print out values to the console to see whether things are what you expect them to be. That’s a perfectly valid and convenient approach, and it is more than enough for simple scripts and simple cases. But when you are dealing with something more complicated, it may not be that easy to even know what values you should be looking at, and you might feel overwhelmed.
That’s when the debugger may come to the rescue.
Opening and activating Core's debugger
Let’s get down to it.
To open the debugger in Core editor, we should select Script Debugger in the Window menu.
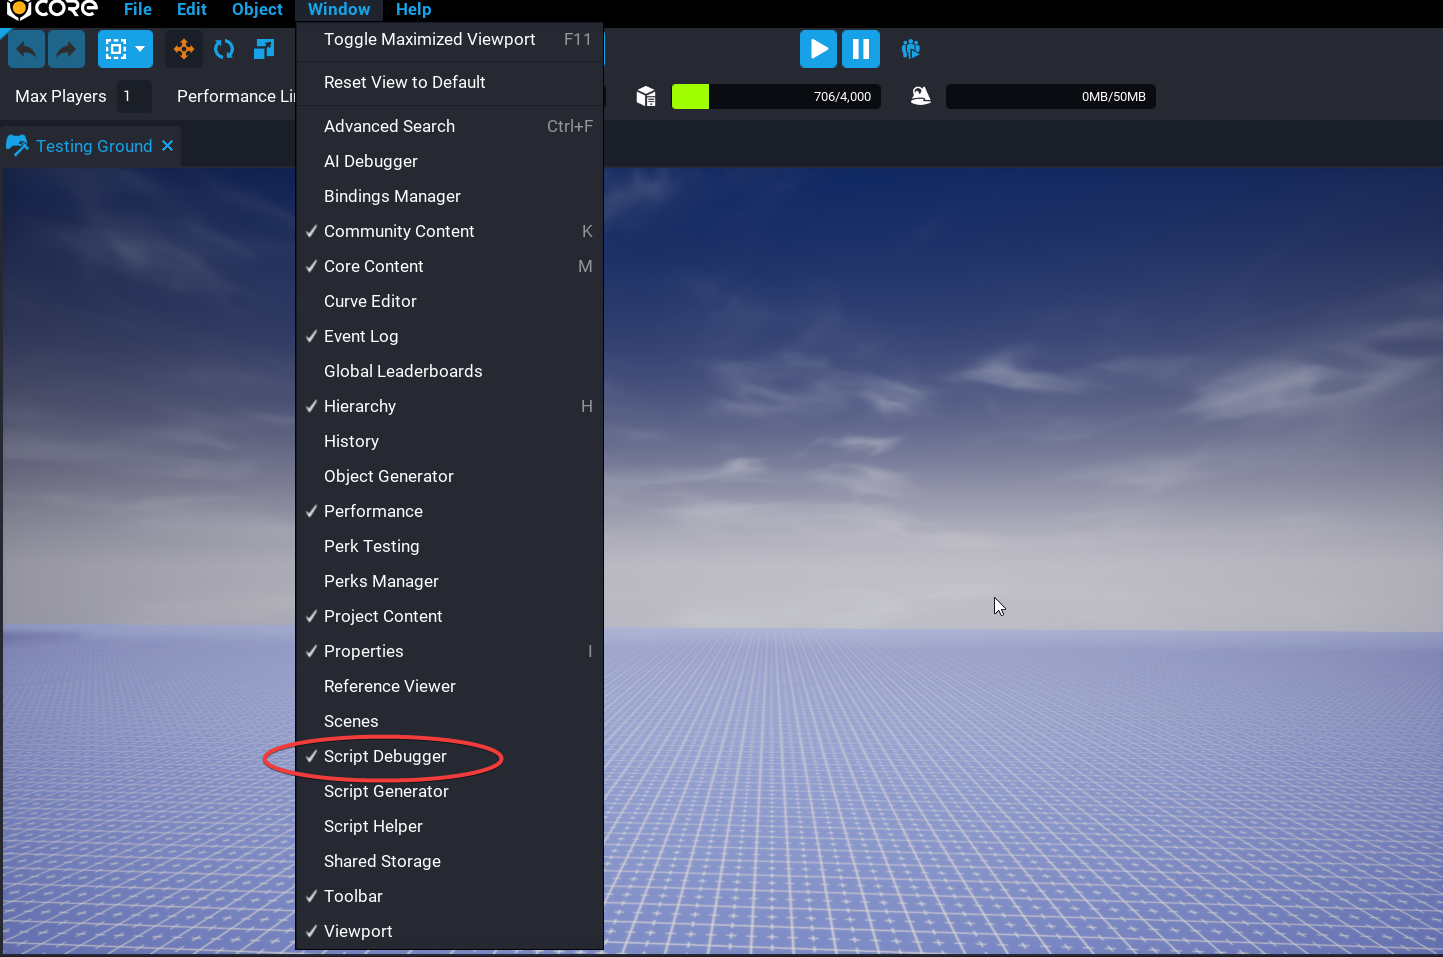
This is how it looks like:
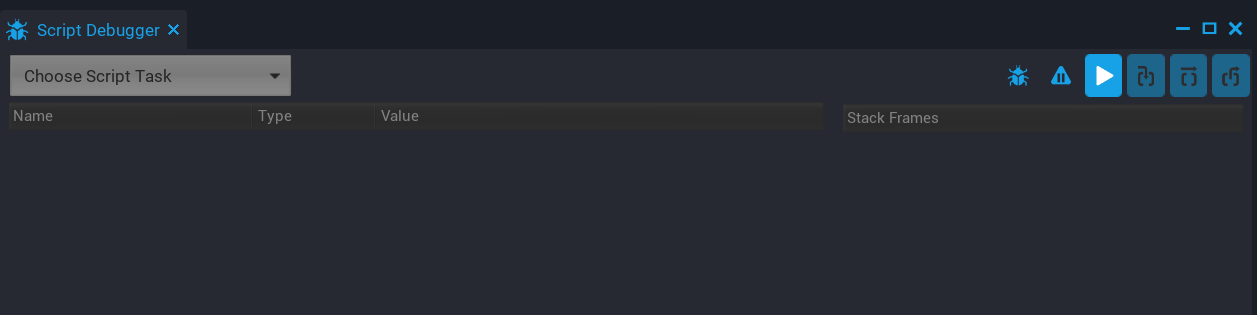
As you can see, the interface is pretty minimalistic.
The first button with a bug icon on it toggles the debugger on and off. Let’s press it.
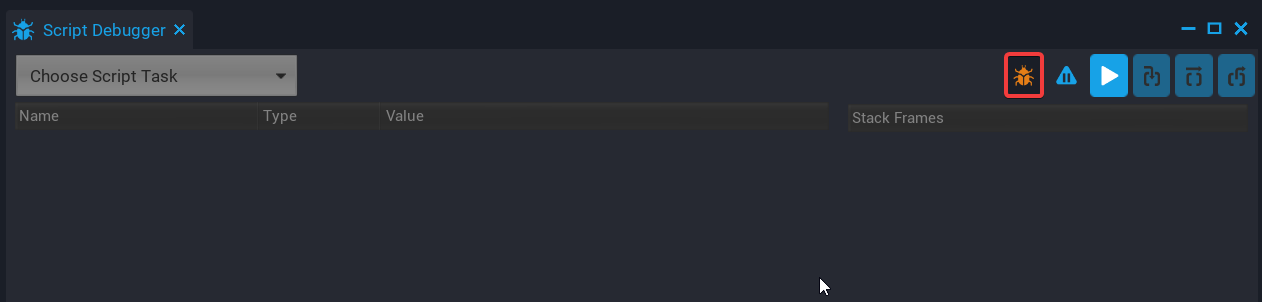
Now that the debugger is on, it will pause your game when a breakpoint (see below) is reached.
Pressing the second button activates the auto pause on error. Let's go ahead and switch on this option as well.
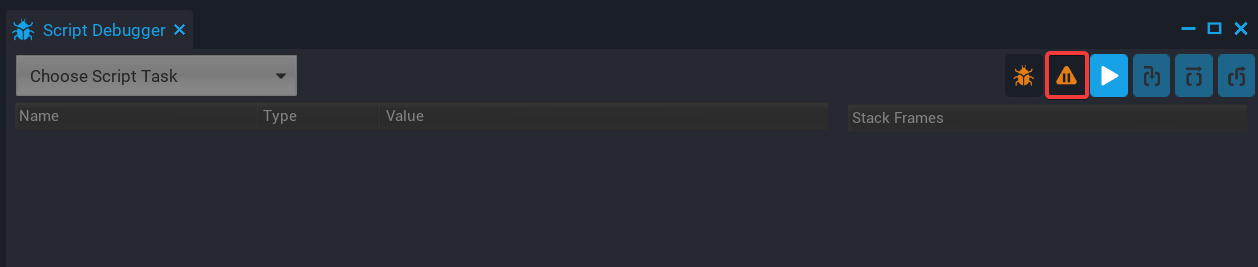
Now in addition to breakpoints the debugger will also pause the game whenever a script causes an error at runtime, letting us investigate the issue right away.
NOTE: After you activated the debugger or the auto pause, they stay activated even after you close the debugger window. You have to press the corresponding buttons again to switch them back off.
A breakpoint is a mark you put on a line of your code that tells the debugger: “I want you to pause right here: at that point of time when this line of code is being executed”.
With no breakpoints in your script, the debugger will not activate (except on errors if you have switched this option on).
To place a breakpoint, you have to right-click on a script, select Edit Script and click on the very left of the line where you want to insert the pause. If the debugger is on, the breakpoint is going to look like a red dot (otherwise it will be black). Should you need to remove one, click on it again.
NOTE: Core Script Debugger works only with the internal Core Script Editor, not external IDEs. To set breakpoints, you have to open your scripts in Core's Editor.
Workflow
Writing some code
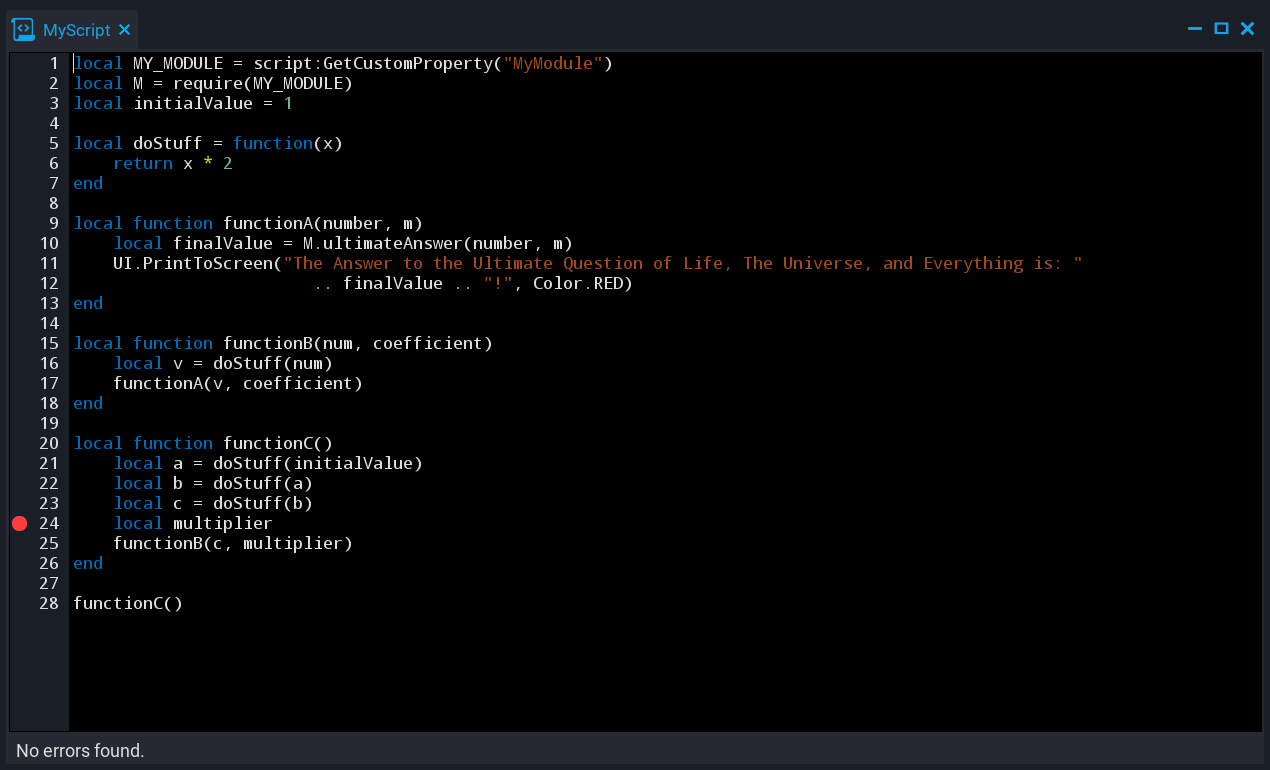
Let’s create a new project, make a new script and put some code in it. Let's pretend this code was written by some programmer unknown to us who had no time to debug the script properly. There are no tests or even comments inside, so it's up to us to sort everything out and make sure all is working as intended.
local MY_MODULE = script:GetCustomProperty("MyModule")
local M = require(MY_MODULE)
local initialValue = 1
local doStuff = function(x)
return x * 2
end
local function functionA(number, m)
local finalValue = M.ultimateAnswer(number, m)
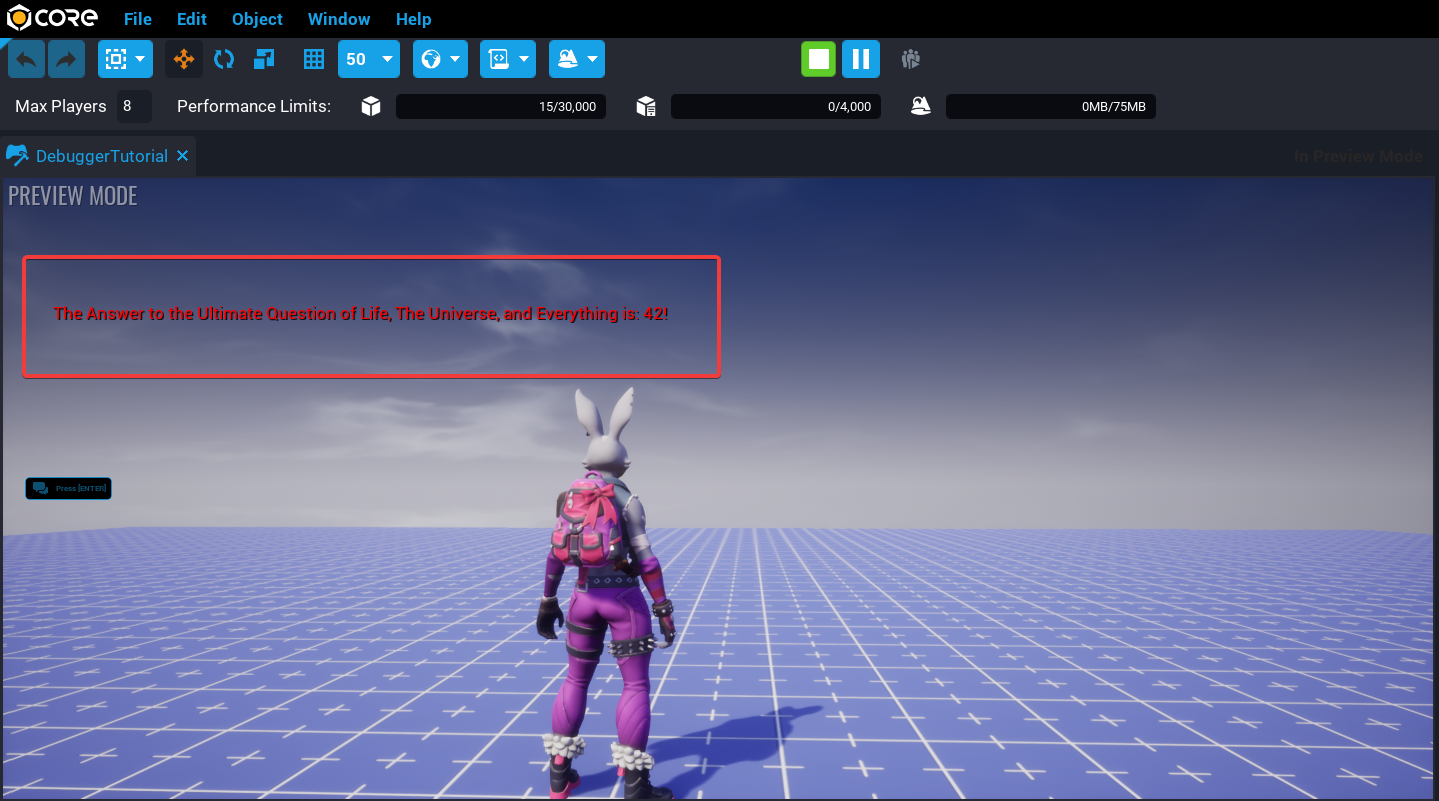
UI.PrintToScreen("The Answer to the Ultimate Question of Life, The Universe, and Everything is: "
.. finalValue .. "!", Color.RED)
end
local function functionB(num, coefficient)
local v = doStuff(num)
functionA(v, coefficient)
end
local function functionC()
local a = doStuff(initialValue)
local b = doStuff(a)
local c = doStuff(b)
local multiplier
functionB(c, multiplier)
end
functionC()
A quick look shows us that here we have several functions, recursively calling one another, performing a few arithmetic operations on the way; plus, a call to a method from an outside module.
To create a module, we’ll make another new script and call it MyModule. Here’s the code that we put inside:
local function ultimateAnswer(strengthOfYourCuriosity, multiplier)
    local a = strengthOfYourCuriosity * multiplier
    local b = a + 42 - a
    return b
end

return {ultimateAnswer = ultimateAnswer}
The last thing to do is to set MyModule as a private property of MyScript so that it will know what he has to look for. For this we select MyScript in the Project Content tab and drag MyModule onto it. Like this:
We then instantiate MyScript by dragging it into the project’s hierarchy; right-click on it, select Edit Script and set a breakpoint, say, at line 24.
Now we can press the Play button – no matter which one: the one on the main panel on top of the editor or the one in the debugger window.
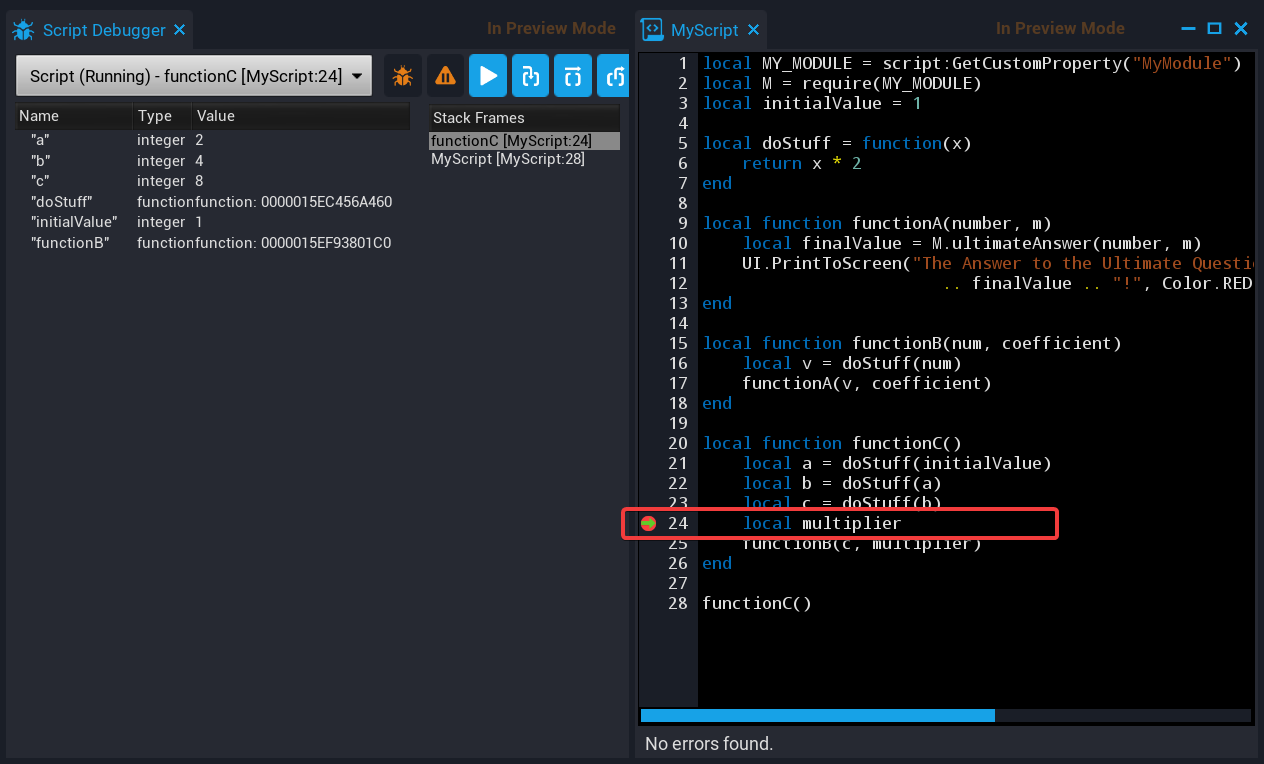
The debugger pauses the game at the breakpoint (a little green arrow shows you where in your code you currently are) giving us some data to analyze.
Analyzing data
- The drop-down menu in the upper left corner shows the task that is running at the moment, as well as the list of all other scheduled and completed tasks. We can switch between them if we want to.
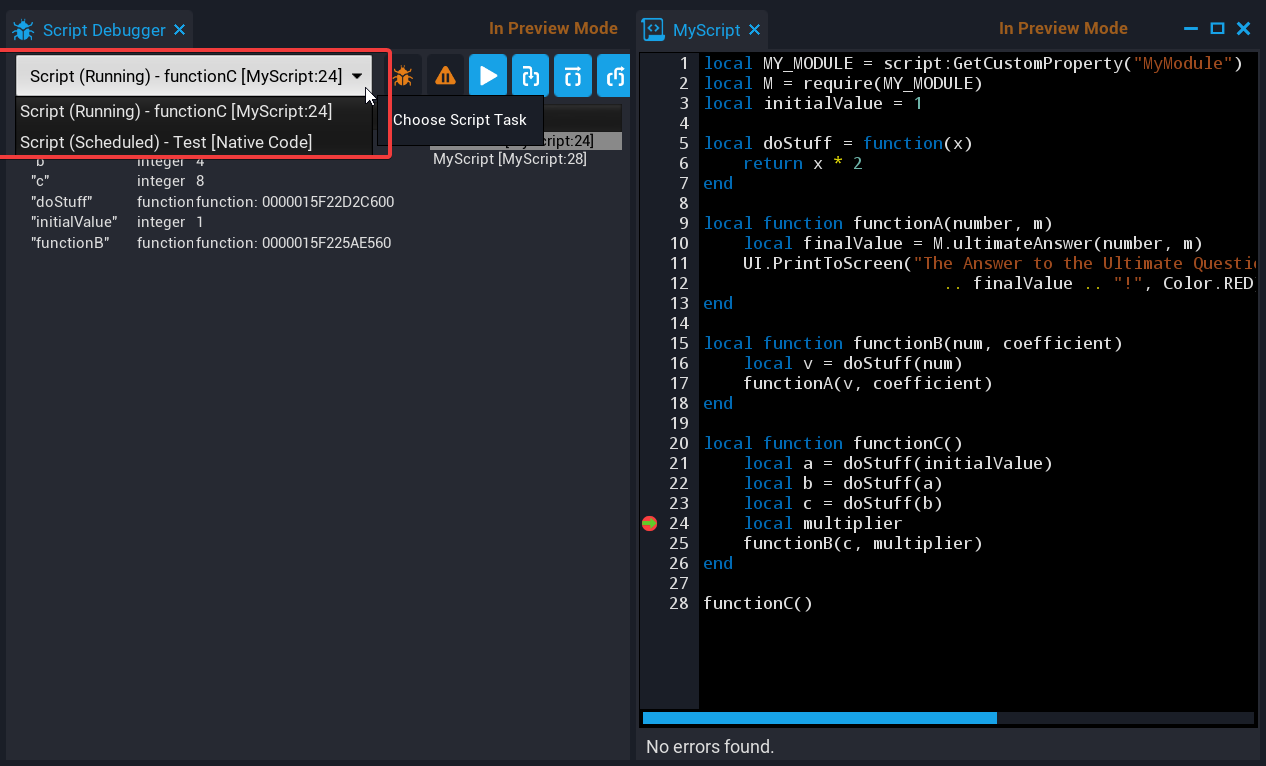
NOTE: This list can be pretty lengthy due to the fact that each script can spawn several tasks: one at initialization, one with Tick() function, one at each direct Task.Spawn() and one at every event callback received.
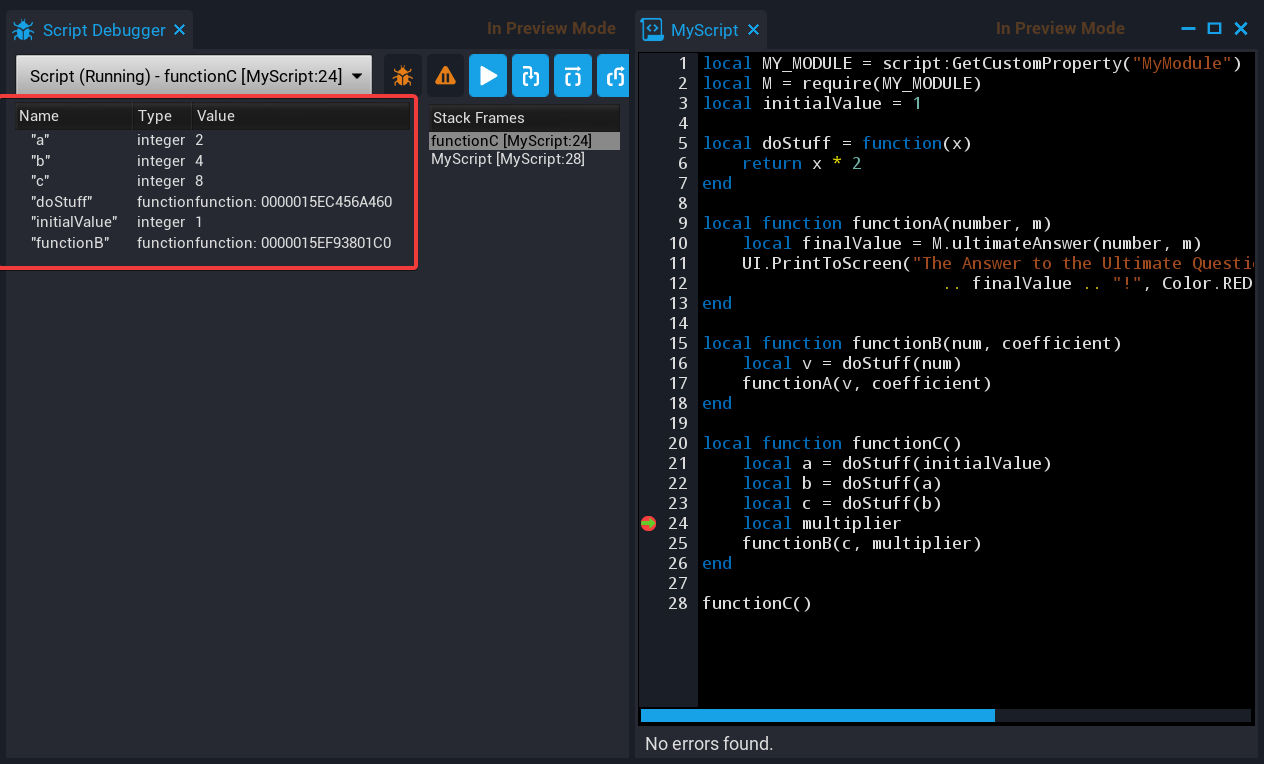
- Below is the stack frame: all local variables that are associated with the scope we are currently in. We can click on those that are expandable (Core type or Lua table) to see their fields.
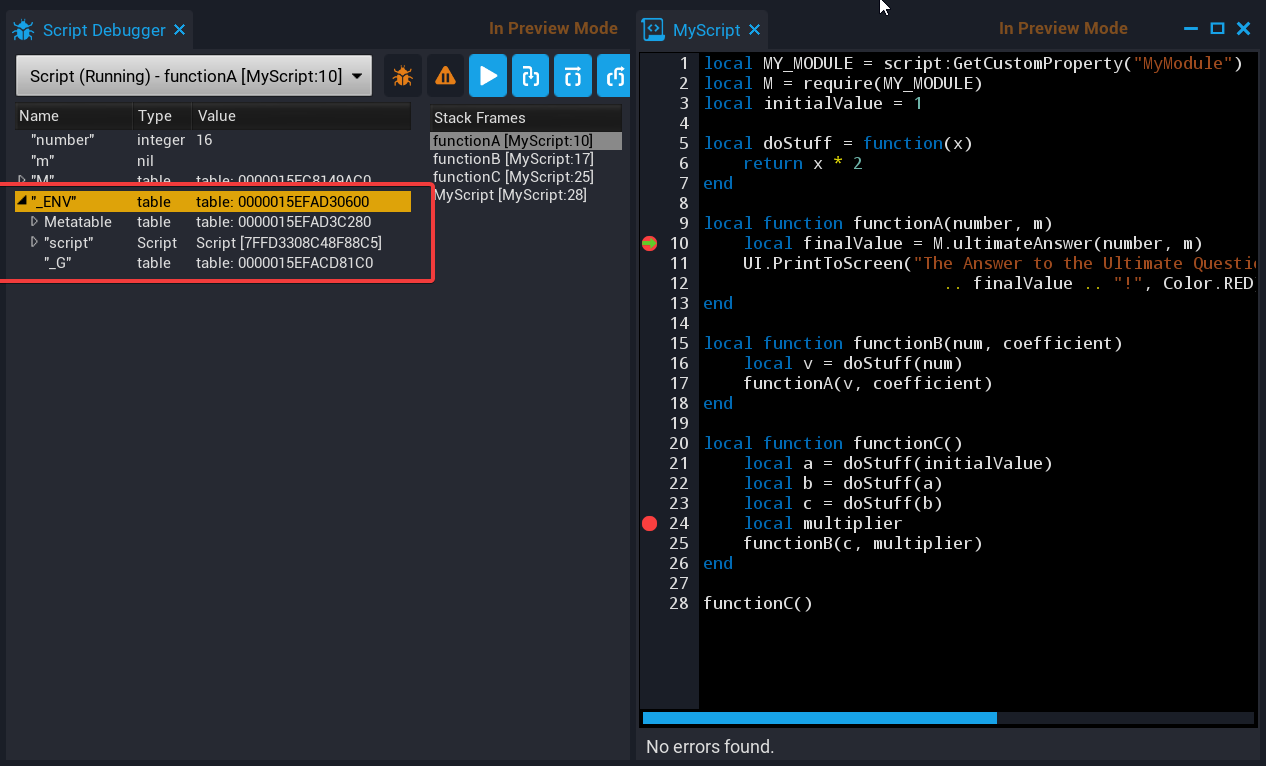
NOTE: While debugging your scripts, you are bound to come across a certain variable called
_ENVvery often._ENVis a predefined external local variable that Lua uses as a global environment.
The thing is that in Lua there are no global variables as such. Instead, all non-local variables are translated by Lua compiler to a field in the_ENVtable. So, you can treat_ENVas a container that holds global variables.
In Core things are even a bit more complicated than that, so, actually, you won't be able to see many global variables, such asprint()ortime().
- For navigating our script in the debugger, we have 3 buttons: Step Into, Step Over and Step Out.
Stepping is moving through the code one line at a time. In order to find where the issue hides, we step through the code and see how the variables change.
-
Step Into

When we press this button, we move to the next line of code. If the line we are currently in is a function, we step into this function – i.e., move to its first line. -
Step Over

When we press Step Over, we move to the next line of code in the current function. Even if the current line is a function, it will be executed as one big step and instead of diving into it we will move to the next line of the function we are looking at. -
Step Out

By pressing this button, we tell the debugger to execute the rest of the function we are in and move to the first line outside of its scope.
Let’s say, you were debugging function A, encountered a call to function B, stepped in function B, made a few steps in there, got what you needed and decided to finish the rest in one step and get back to function A to pick up where you left off. That’s what Step Out will do for you.
- The column on the left shows the sequence of stack frames – the call stack.
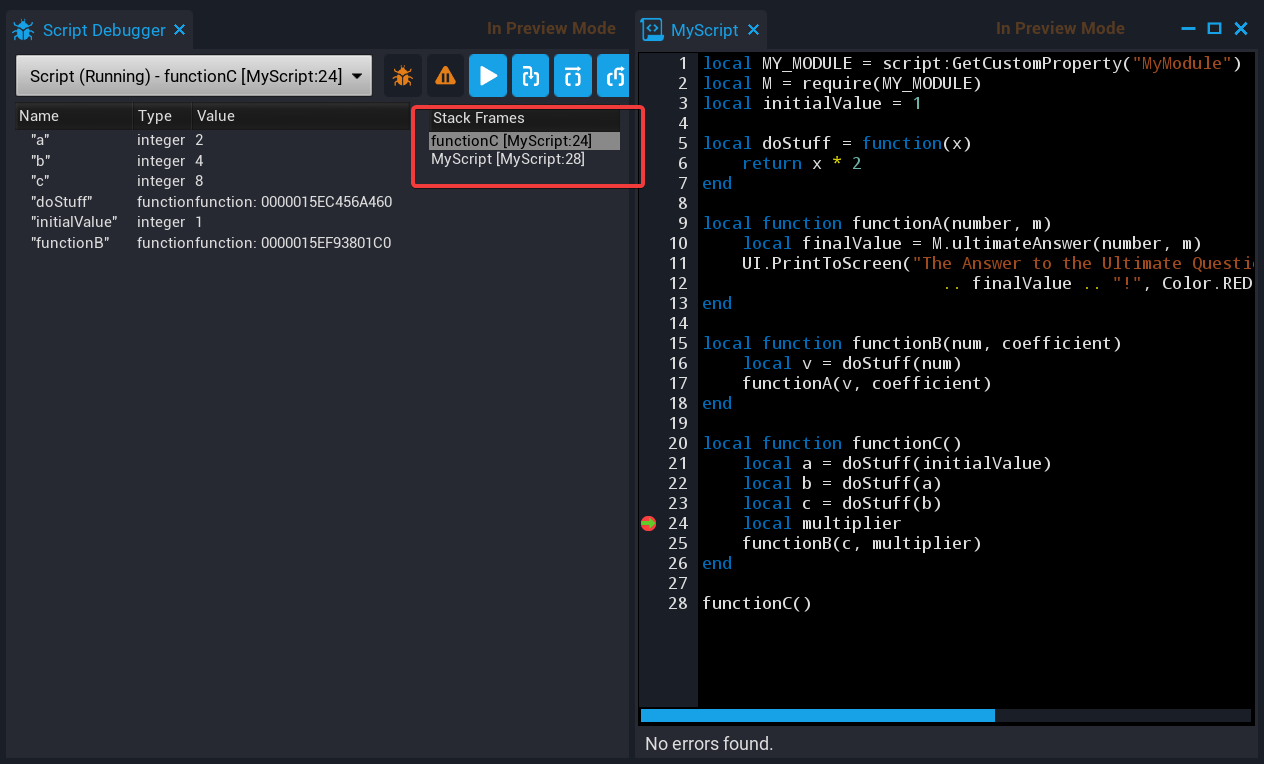
This column shows the whole trail of function calls that led us to where we are now. The cause of an error in most cases lies in some other place from which the error eventually emerged – so this is a very convenient way to track down the issue.
We can click on each stack frame and examine the variables stored in there. Or double-click and get to the specified line of code in the editor.
Okay then.
Debugging the script
Let's press Step Over, and, since there is no function on the way to actually step over, we’ll simply get to the next line.
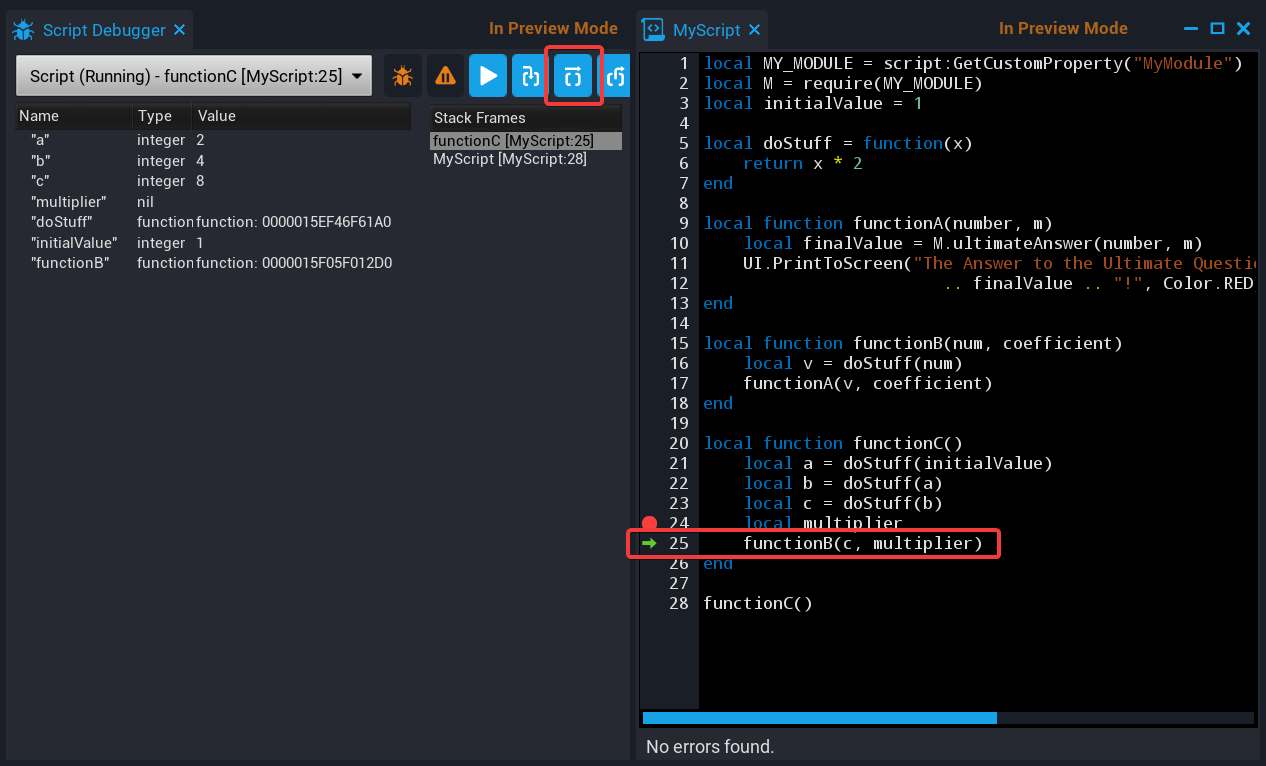
There is a function call on line 25. We’ll press Step Into, and this will get us inside of the function, to line 16.
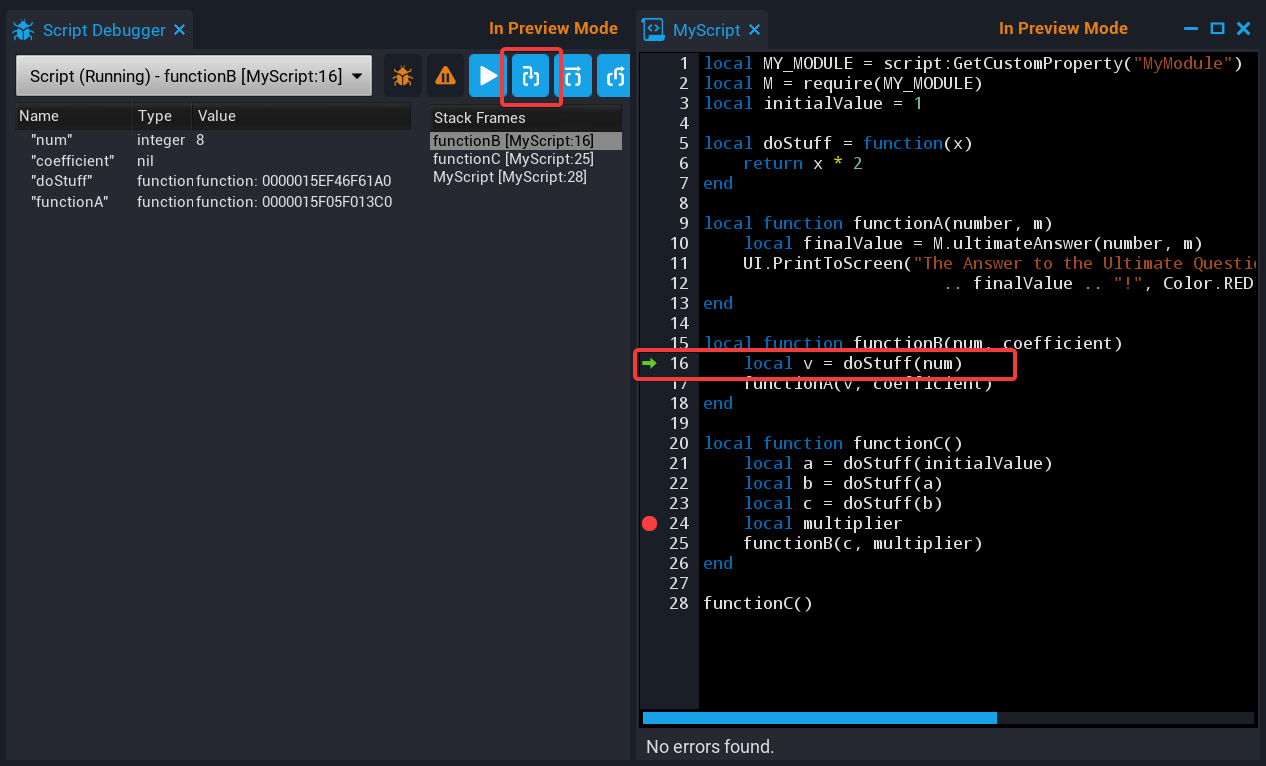
Everything seems pretty okay here, so we'll press Step Out, and… oh my! – we get an error message!
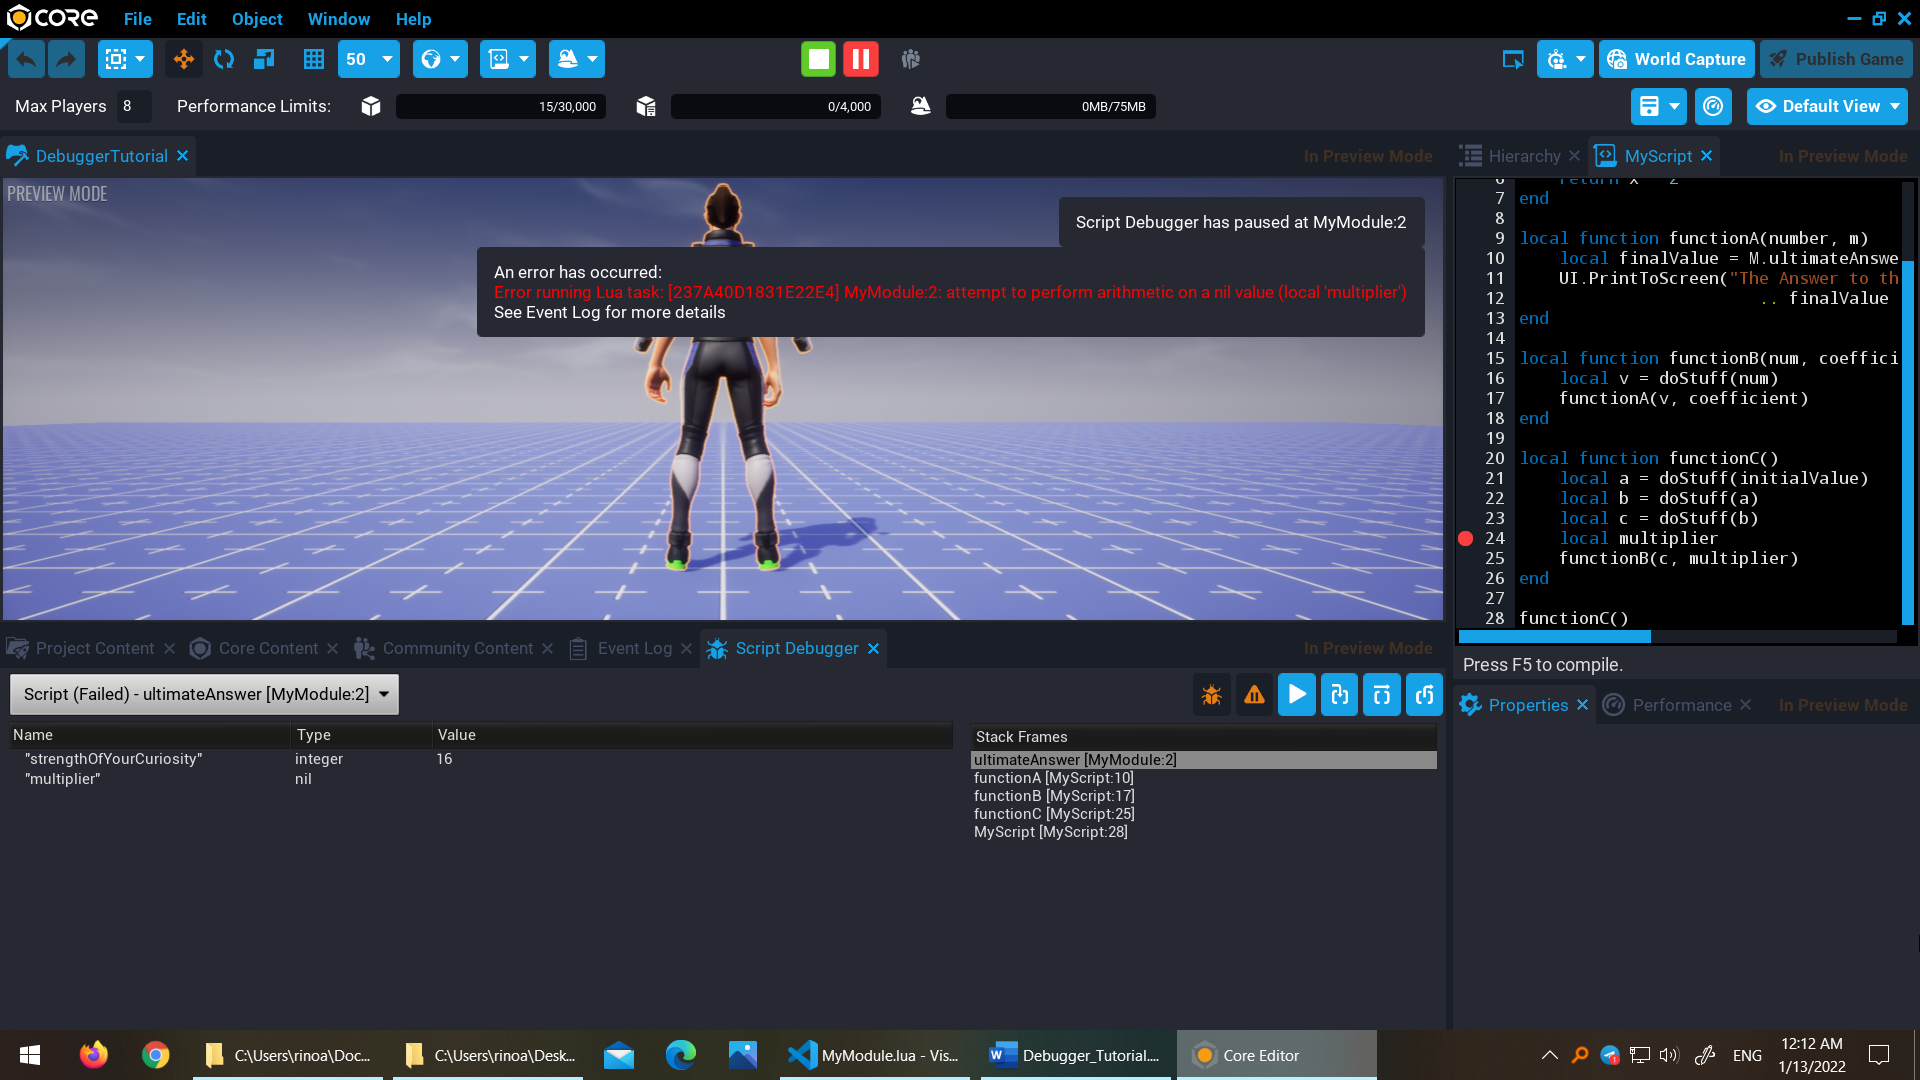
The debugger pauses the script again to let us get into this issue immediately. And so we will.
The very first stack frame is already selected.
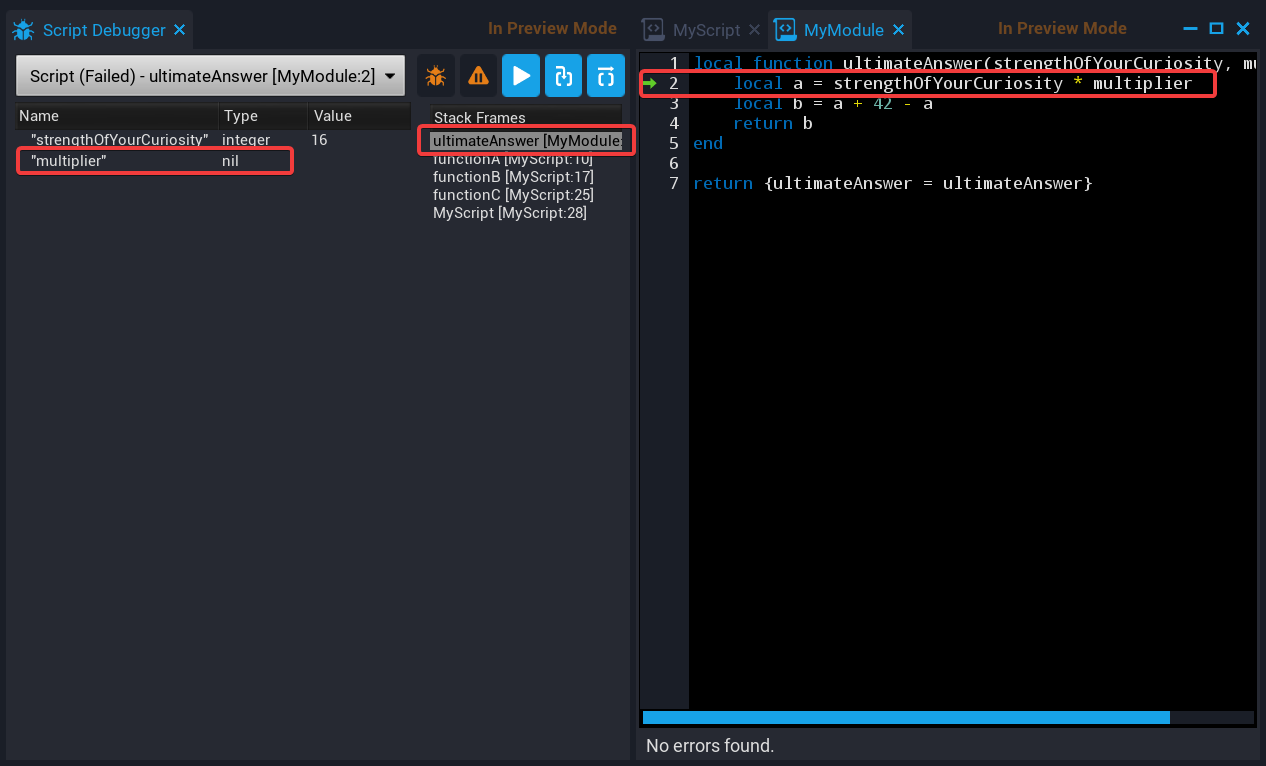
It corresponds to the call to the ultimateAnswer function of the module script and has two variables, “strengthOfYourCuriosity” and “multiplier”. The value of “multiplier”, as we can see, is indeed nil. We double-click on the stack frame to see this line of code in the editor – and, sure enough, there is an arithmetic operation performed on this variable – which, of course, is bound to fail if the value is nil.
We can also see that the value of this variable is being passed as a parameter when the function is being called outside of the module script. So, it seems we must investigate further.
We choose the next stack frame. It corresponds to line 10 of MyScript.
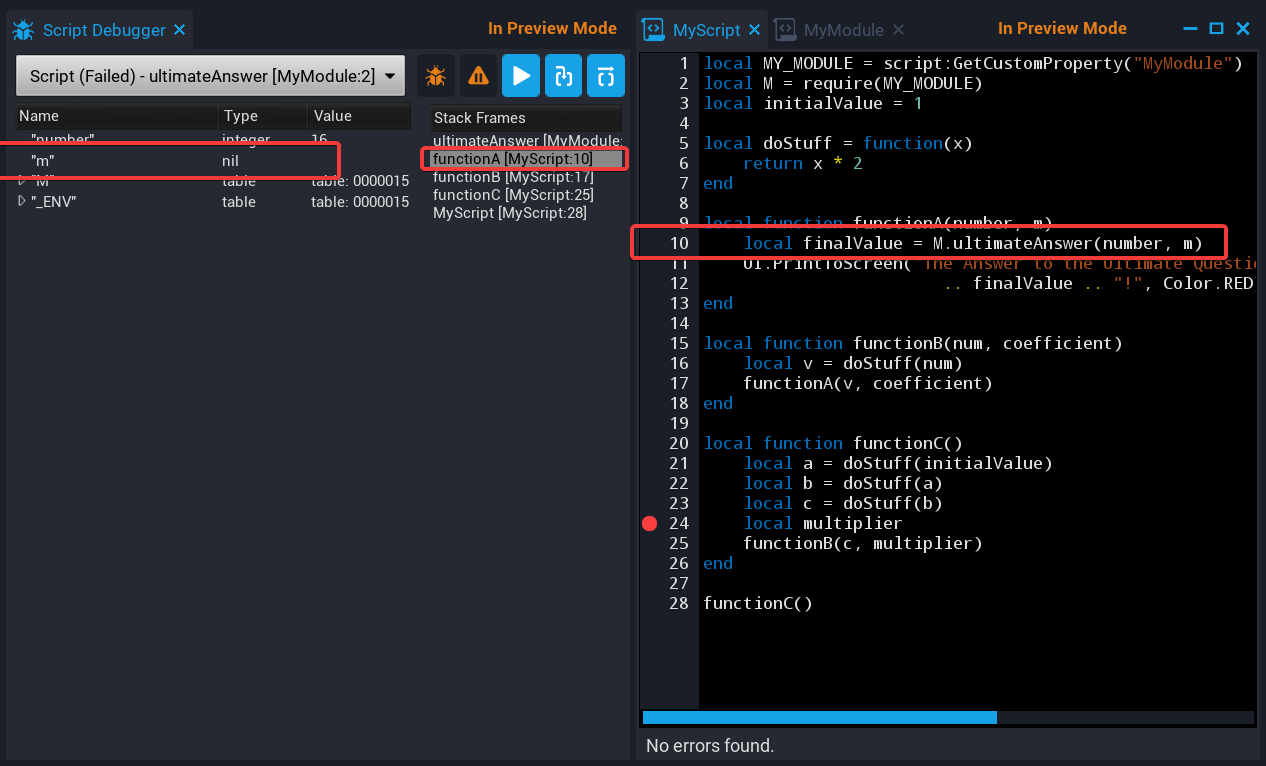
Let’s see what’s going on there. Here’s the call to the ultimateAnswer function of the module script. The parameters that are being passed are the variables, “number” and “m”, and the value of “m” is nil. And we can see that both these values are passed from yet another place! Let’s go there then.
Next stack frame directs us to line 17 of MyScript.
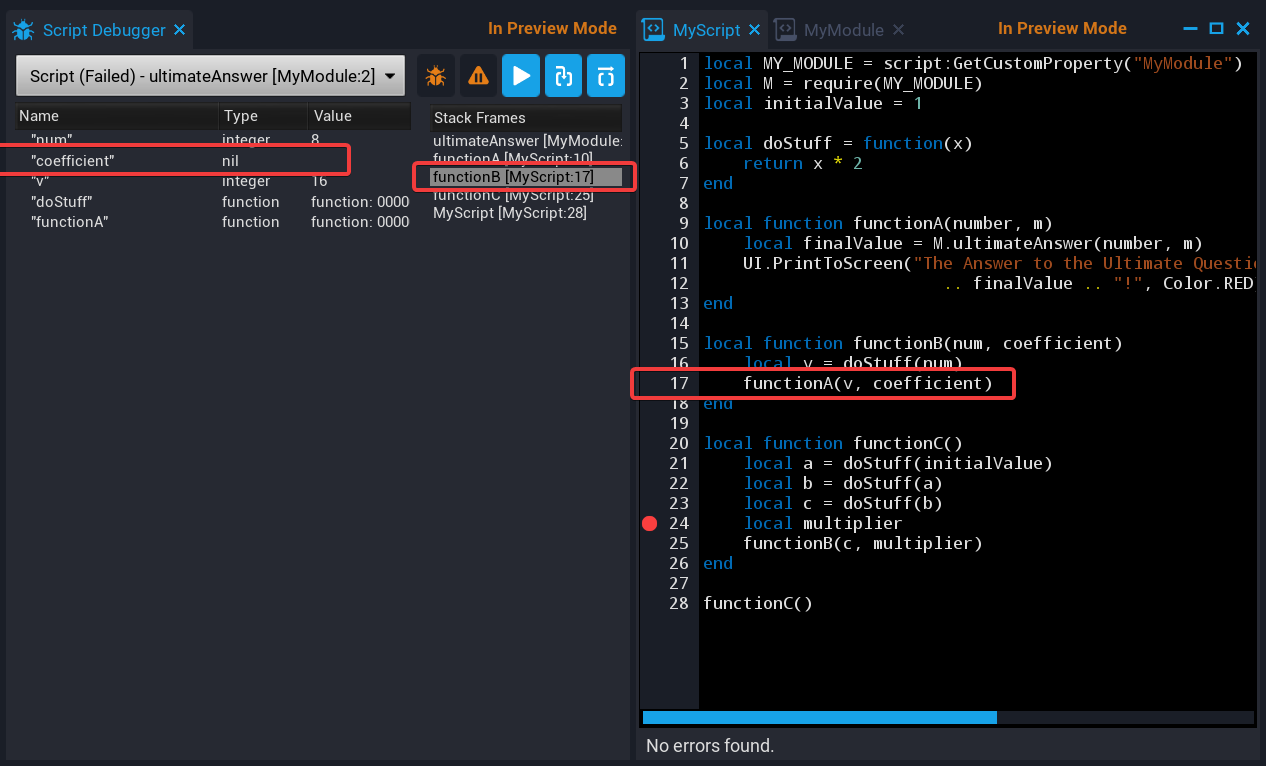
And the picture there is similar: 2 variables, “num” and “coefficient”, one is nil, both passed from somewhere else. Let’s keep going.
Next stack frame, next function.
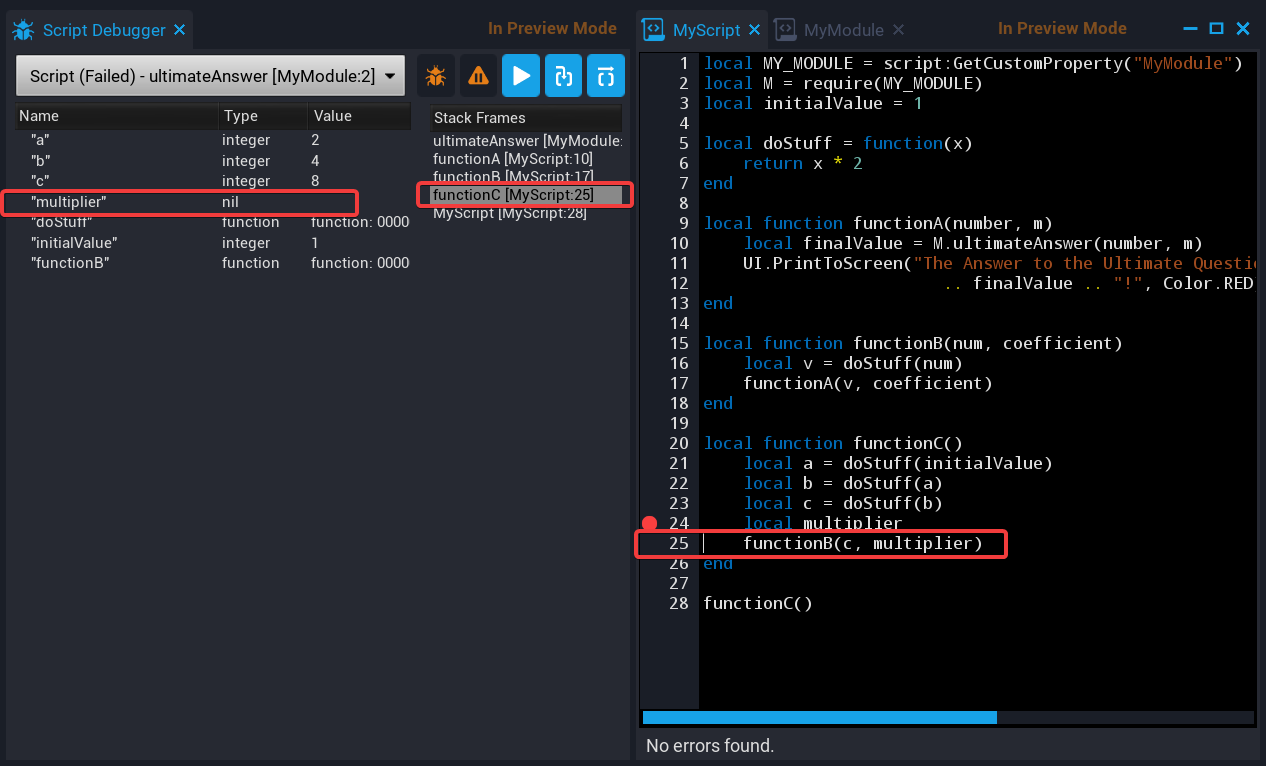
A variable with nil value again. Let’s take a look at the code. Line 25 – as we may have expected, nil is being passed as a parameter to another function. Line 24 –
Finally! Here’s the “multiplier” is being declared, but no value is assigned to it. This seems to be the source of our error. Let’s correct it.
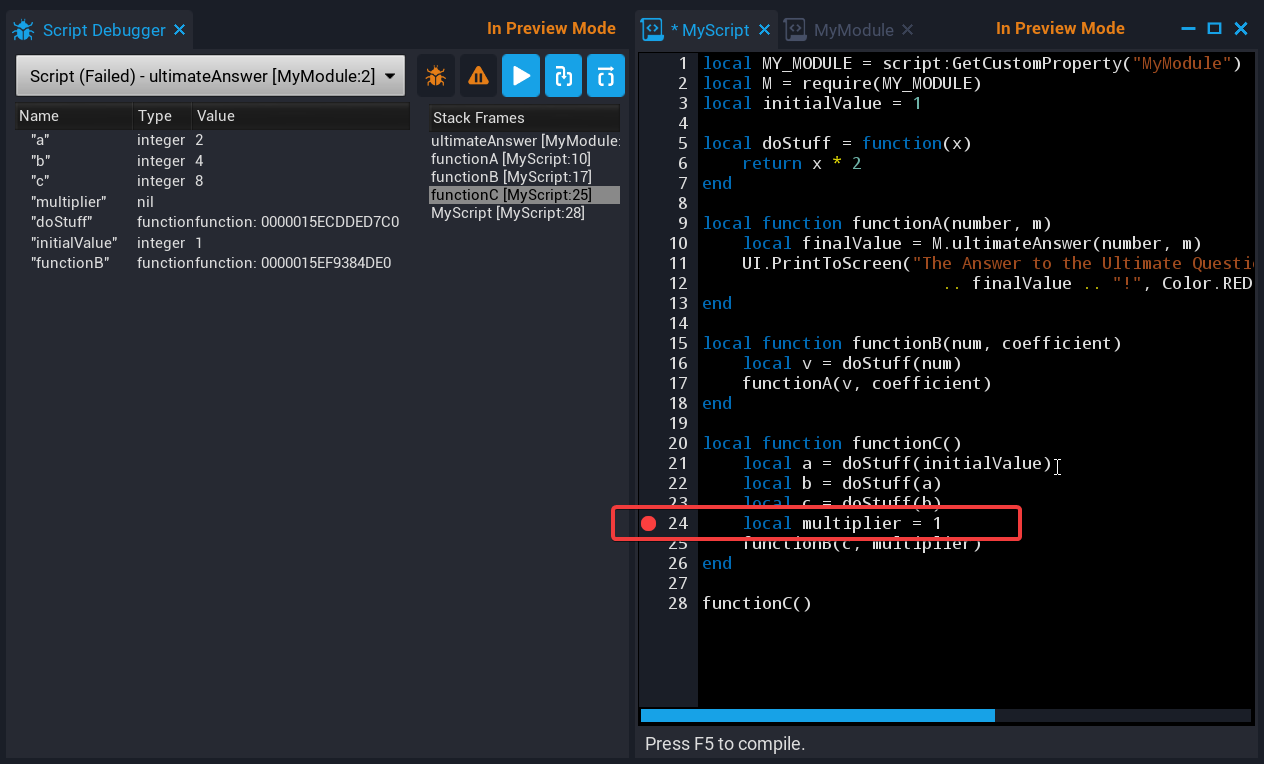
Let’s turn off the debugger (by pressing the little button with a bug icon on it) and hit Play.
Success!
At last we get the answer to the Ultimate Question of Life, the Universe, and Everything!